About a year ago, I “factory reset” my phone in a fit of frustration. That was March 13, 2012. Here’s every text message I sent and received in the following 365 days:
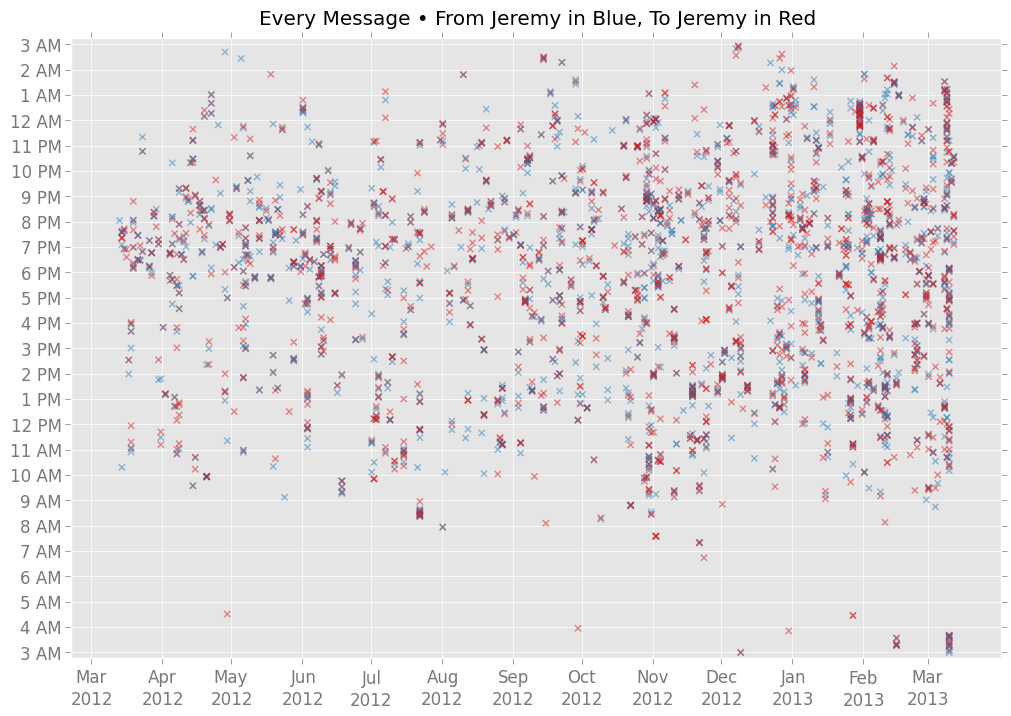
There are 3,293 x-marks on that chart. It’s a bit overwhelming, but you can see some patterns. For instance: the vertical streaks — like the one between 11:30 p.m. and 1 a.m. one night in late January — represent hyperactive stretches of texting. And you tell can I never texted between 5 a.m. and 6 a.m. all year.
To get this data, I used the free SMS Backup & Restore app for Android. The program let me download all my texts as an XML file, which I then converted into a CSV. I’m only counting messages exchanged with “known” contacts — not spammers, wrong-numberers, or boarding pass–senders.
The data contains at least three different types of variables — continuous, categorical, and time-based. To analyze and chart them, I got to use a couple of Python tools I’d been wanting to learn: pandas and matplotlib.
In the giant scatterplot above, you might have noticed a general increase in text messages over time; there are more marks on the right half of the chart than on the left. To get a better sense of that trend, here’s a plot of messages by month:
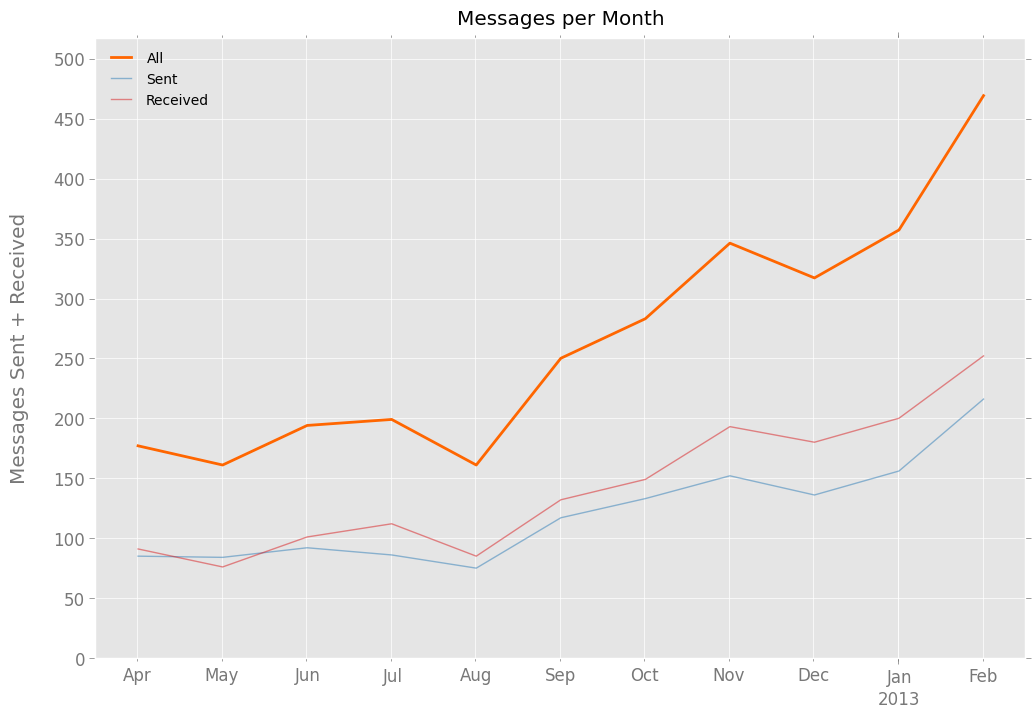
That chart was pretty surprising when I first saw it. I had a vague sense that I’ve been texting more often, but would have pegged the increase at 50%, maybe 75%. Instead, it seems I exchanged three times as many text messages in February 2013 than in April 2012. (Those are the first and last full months in the dataset.)
The total number of characters — letters, numbers, spaces, punctuation, etc. — soared, too, to 25,000+ in February:
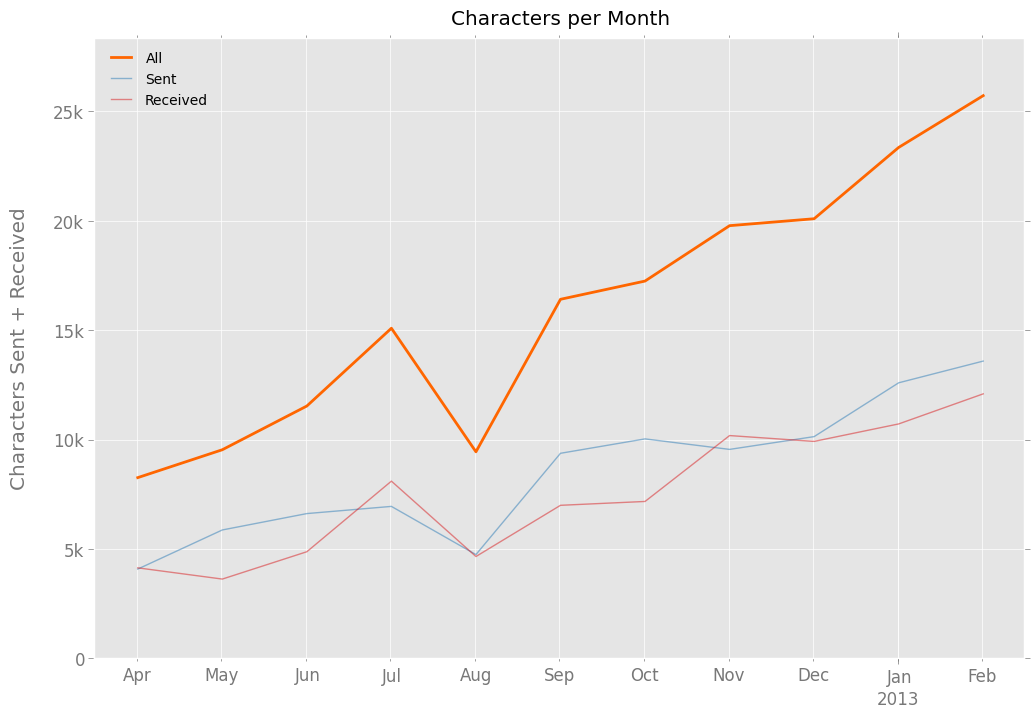
The thin blue and red lines in the two charts above indicating that, while I sent fewer text messages than I received, I sent more characters that I received. In numbers:
-
I sent 1,514 messages, or 4.1 per day, to known contacts. I received 1,779, or 4.9 per day. So for every 100 messages I sent, I received about 118.
-
I sent 104,406 characters, or 286.0 per day.1 I received 92,610 characters, or 253.7 per day. So for every 100 characters I sent, I received about 89.
-
Messages I received were, on average, 52 characters long. Messages I sent were 69 characters long, on average, or 32% longer than those I received.
In the two histograms below, you can see this “verbosity gap” in more detail:
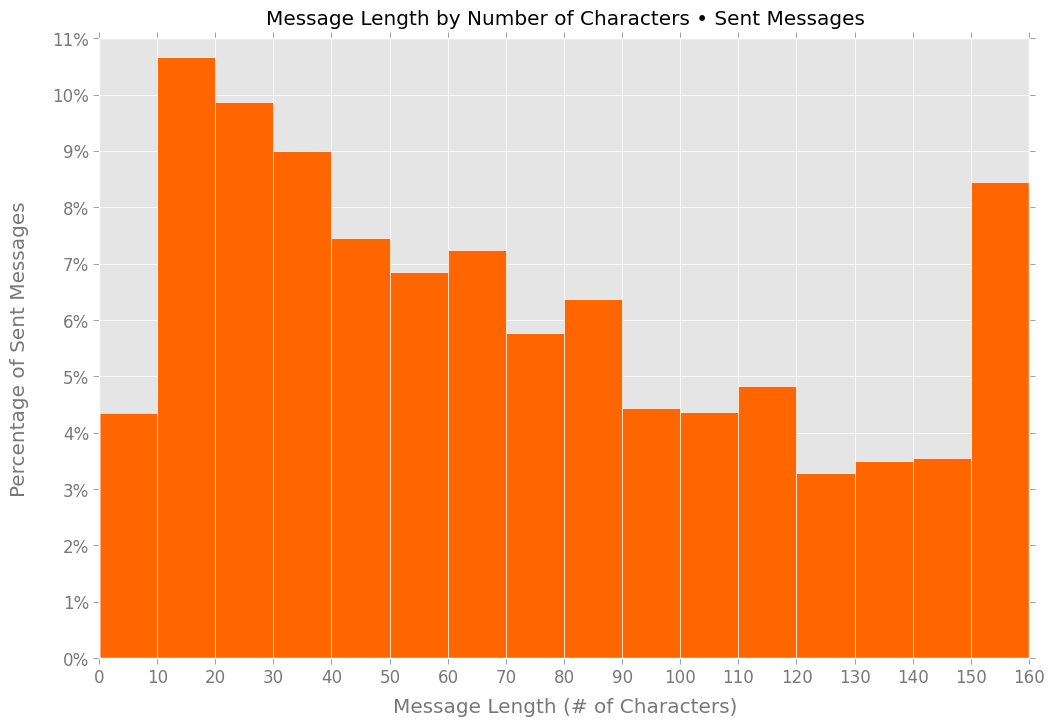
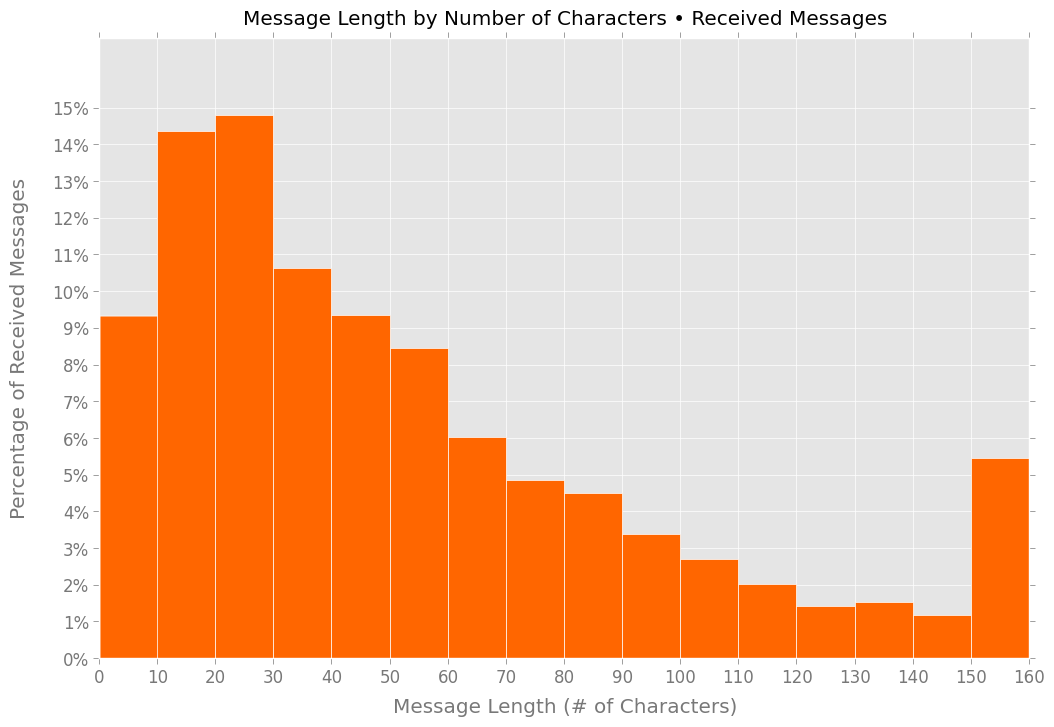
The skew is most apparent at the very-short and very-long extremes. More than 8% of the text messages I sent were longer than 150 characters; roughly 5.5% of the messages I received were that length. And less than 5% of the messages I sent were 10 characters or shorter; people sent me such super-short messages more than twice as often.
I’m not surprised to see I sent longer text messages; I like jamming as much meaning as possible into a single message, and I don’t like abbreviations. But I had no idea I was so much more verbose than my friends, family, and coworkers.
Here’s the same data, split into weeks:
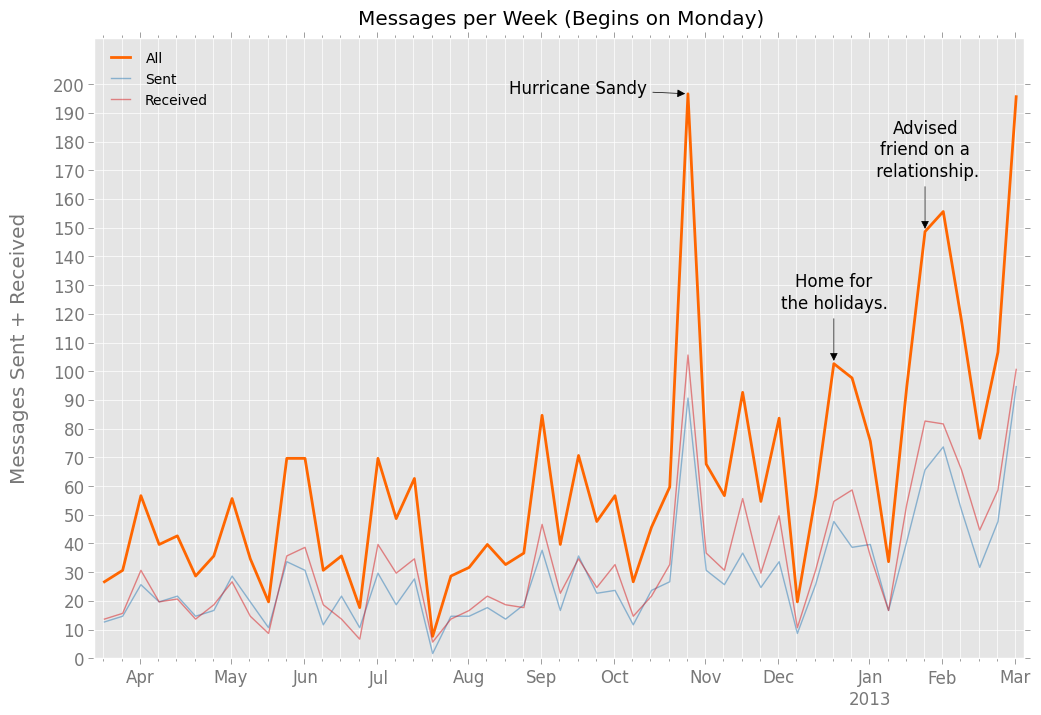
My apartment lost power the week Hurricane Sandy hit. In the mornings and evenings, I conserved my phone’s battery by turning off the data connection and communicated more often by SMS than email.
I do something similar on weekends — no email, no Twitter, as little smartphoning as possible — so it makes sense that I’d text more on Friday, Saturday, and Sunday than other days:
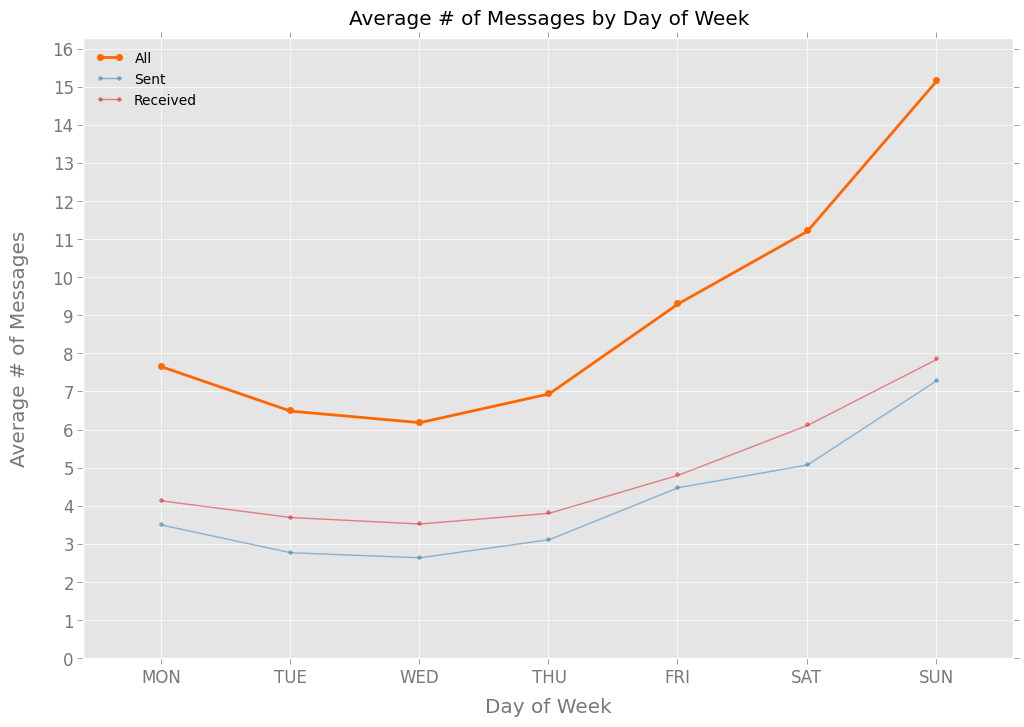
That chart mirrors pretty closely what I would have expected, including the nadir on Wednesdays. Here’s the same data, but now grouped by hour of the day:
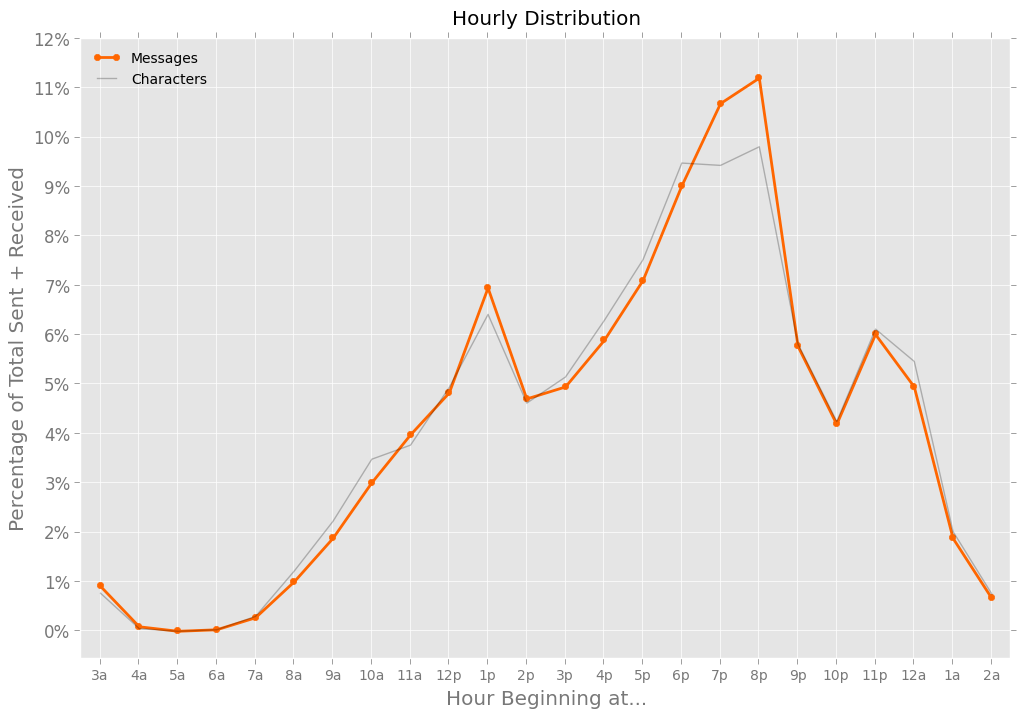
Follow the thick orange line, and you’ll see my text messaging increase from morning until dinnertime, and decrease through the rest of the night, with a couple of smaller spikes around lunchtime and the late evening.
The gray line, which tracks characters rather than messages, follows a similar pattern. But note where they diverge: dinnertime, between 7pm and 8:59pm, when I sent relatively fewer characters per message. Those hours are filled with messages like “About 10 mins away,” “Seeya soon!” and “Great! On my way. Beer? Wine?”
Now let’s look at actual people, or at least numbers representing actual people. Here’s a chart that tracks the number of different contacts I messaged in any given month:
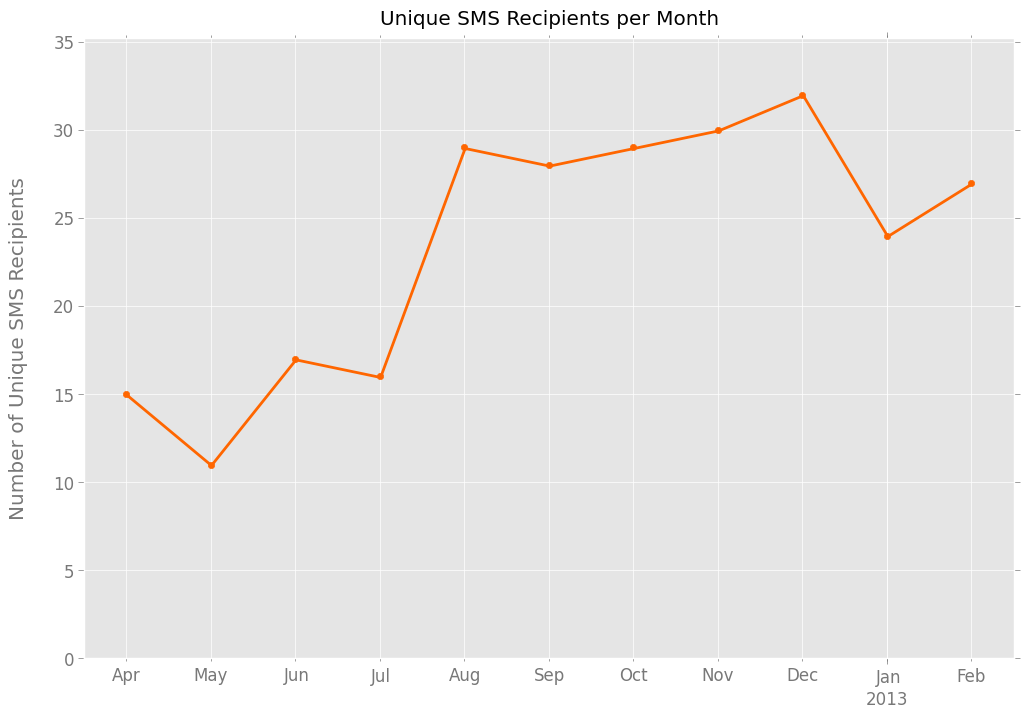
What happened in August, when that number nearly doubled? It’s hard to say. I would have expected that bump to come a month earlier — July was my first month in a new apartment, in a new borough, and out of a yearslong relationship. Perhaps those changes had no effect. Or maybe they just took an extra month to manifest. Whatever expanded my texting circle, it seems to have lasted.
Unsurprisingly, I text frequently with only a small fraction of these people. To wit, I exchanged 10 or fewer messages with 42% of them …
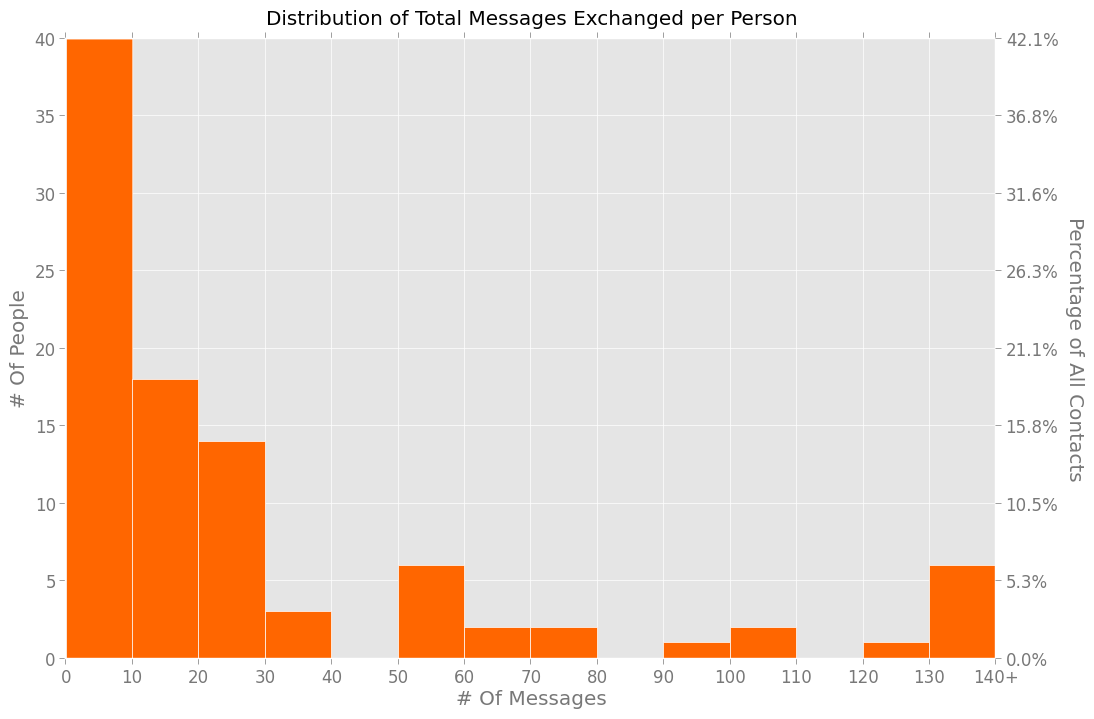
… and exchanged more than 130 messages with just seven people.
I also wanted to see how my use of certain words, phrases, and punctuation differed from other people’s, so I made this awkward-looking chart:
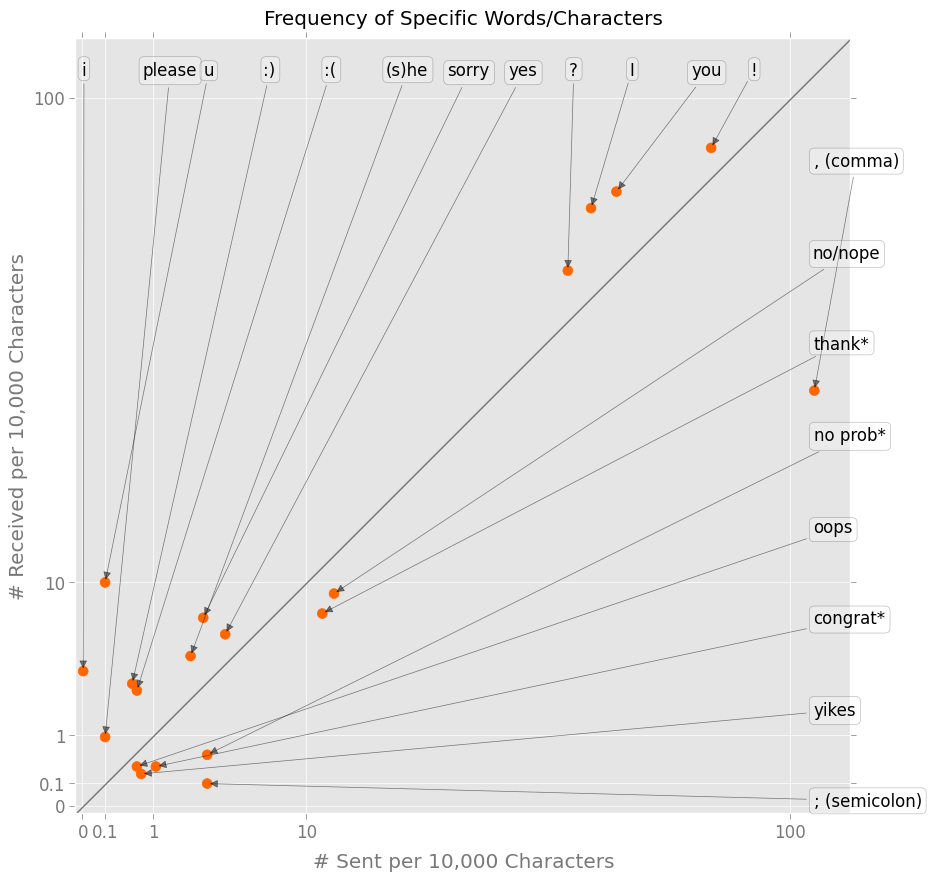
It plots the relative frequency of bits of punctuation and language in the messages I sent versus received. (They’re plotted on a square-root scale to fit the outliers without losing too much detail.) Some findings:
-
I never to used “i”, and only received it a few times per 10,000 characters.
-
I used commas and semicolons more frequently than other people; they used “?”, “!”, “:)”, and “:(“ more often.
-
I sent variations on “congrat(ulation)s” and “thank(s)” a bit more than them; they sent “please” and “sorry” a bit more than me.
-
I used “he,” “she,” and “you” — and presumably other pronouns — less often.
What to make of all this?
I don’t plan on writing shorter messages, using fewer commas, or reining in other idiosyncracies just to approximate the norm. But I might try shifting some texting from the evening to the daytime — will friends find this a pleasant surprise? — and try being more generous with emoticons.
The code
I used IPython for the first time for this project. An .ipynb file containing all the code, analyses, and charts — including some I left out here — are in the same repository as this draft. You can view it here or by cloning this draft’s repository: git clone http://drafts.jsvine.com/one-year-of-text-messages.git
-
Assuming 2,000 characters per printed page, I wrote about 52 pages’ worth of text messages during this time. ↩